geog595
Practical Exercise 3: Spatial database management using SpatiaLite
Instructor: Bo Zhao, zhaobo@uw.edu; Points Available = 50
In this practical exercise, we introduce how to manage a spatial database using spatialite. In the GIS industry, there are multiple spatial databases, such as ESRI geodatabases, postgresql(with postgis), Oracle, and spatialite. These databases are designed for database of different size and in different usages. Spatialite is a file based database, derived from sqlite and supported by a few open source GIS libraries. It is worth noting that, compared to other existing databases, Spatialite can apply for mobile development and multiple operating systems. Since Spatialite can manage both spatial data and common attribute data tables in one database file, it actually makes the geospatial data management much easier if compared with Shapefiles which needs multiple files to store one piece of geospatial data. Besides, SpatiaLite has extended the common SQL functions and supported a series of spatial functions to conduct advanced spatial queries or joins. Thus, to get familiar with its functions and usages, this practical exercise will introduce how to build a spatialite database, create data tables, insert geospatial data, and eventually visualize and analyse the data in a geographical layout. In this exercise, you will build a twitter api to collect geo-tagged tweets and store the retrieved tweets to a spatialite database instead of a csv file. Okay, let us get started!
Please launch this crawler script by clicking this button ![]() . This button will enable you to open the file 04_data/tw2db.ipynb on Google Colab.
. This button will enable you to open the file 04_data/tw2db.ipynb on Google Colab.
1. Environment setup
To setup the working environment, you will need to install QGIS 3.+. QGIS is an integrated GISystem, which has been considered as the open source alternatives to ArcGIS. To install QGIS, make sure its version is greater than 3.0. Please download it from https://qgis.org/en/site/forusers/download.html. In this practical exercise, we mainly use its DB Manager function for spatial data operations.
2. Manage geospatial database using SpatiaLite
2.1 Create a spatialite database
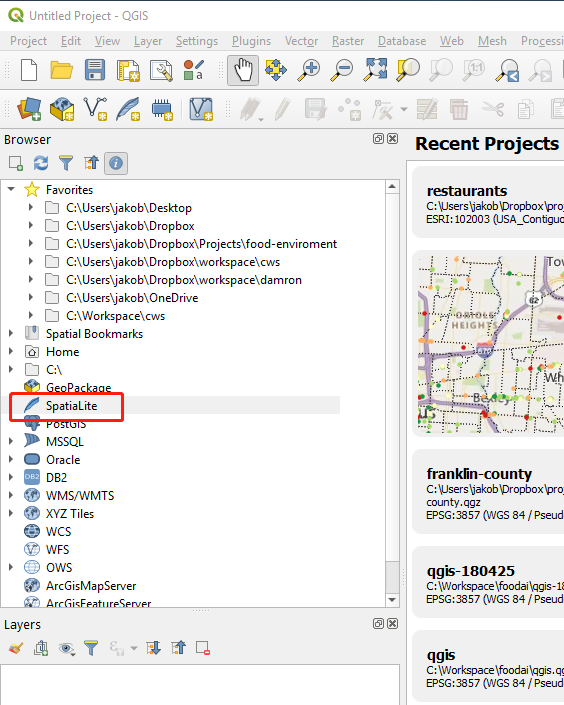
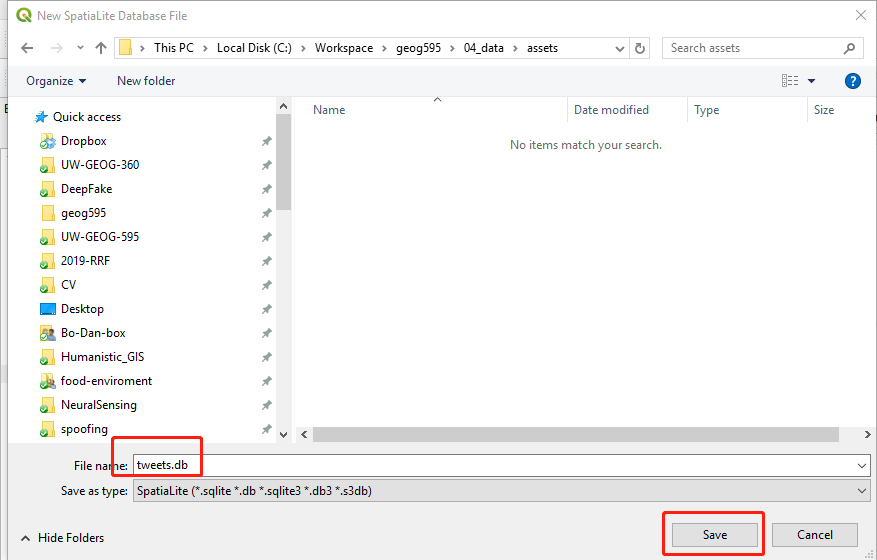
The most convenient way to create a spatialite database is to use QGIS. Open a QGIS (version >3.0) application. In the browser panel on the left, please right-click the SpatiaLite icon. In the pop-up dropdown menu, press Create Database.... The name of this database is tweets.db, which is stored under the assets folder.
After inputing the database name, an empty spatial database will be created. We can find this newly created database by navigating to its location.
2.2 Initialize a data table
In order to properly use this database, we will do several queries to construct a data table within this database. The sql statement can be found in create_table.sql.
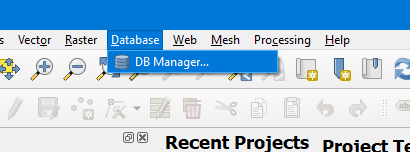
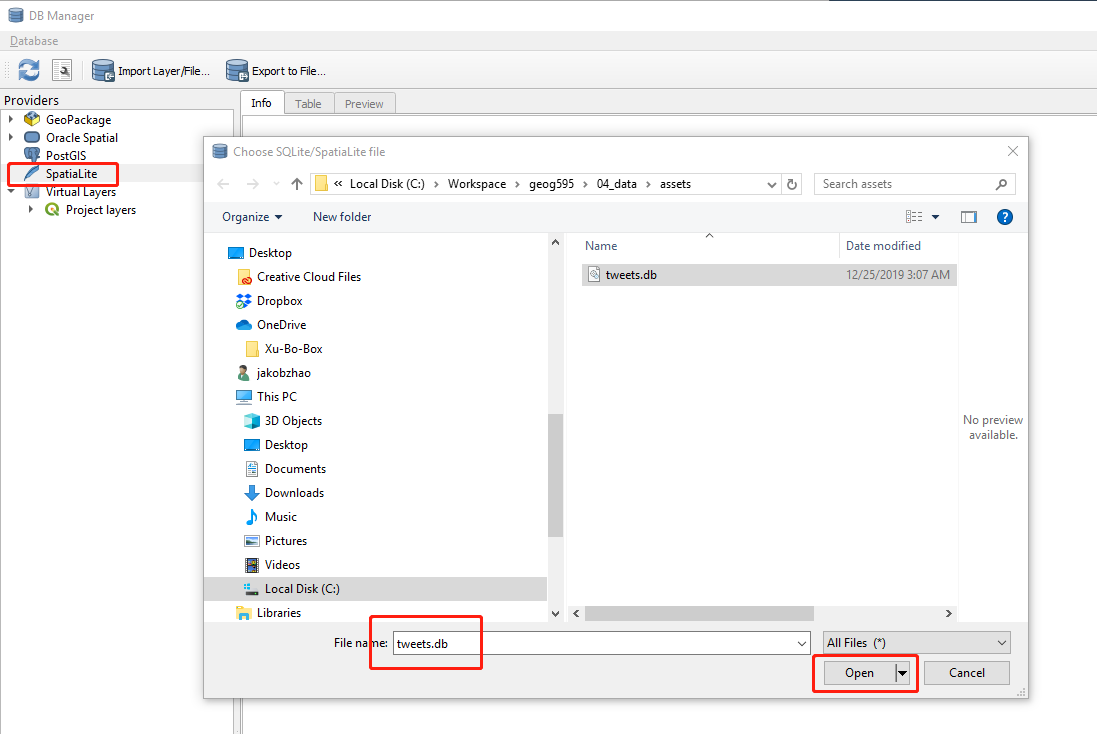
Navigate from Database on the main menu bar to DB Manager.... In the pop-up interface, Right-click the SpatiaLite item on the provider panel to build a new connection. Use this New Connection connects to tweets.db.
On the DB Manger interface, Navigate from Database on the main menu, and then open up the SQL window. In the popup window, please input the first SQL statement, and press Execute.
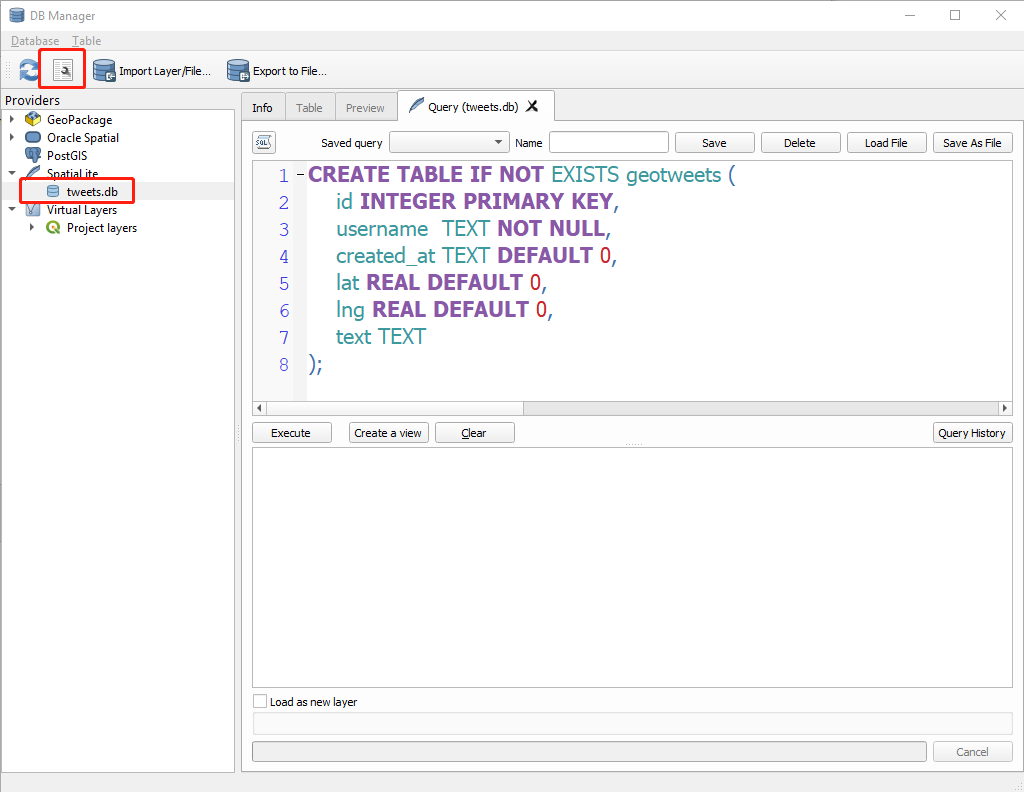
Once executed, a new table named geotweets is created. This data table has several fields, such as id, username, created_at, lat, lng, and text.
Once a database is initialized, please uploaded to Google Drive, and create a variable to store the path.
dbname = '/gdrive/MyDrive/tweets.db'
2.3 Initiate the crawler
Above all, please install one required python libraries - sqlite3. If you running the code on your local computer, you need to execute the following shell script to install sqlite 3 on command prompt (if a windows user) or terminal (if a Mac or Linux user).
pip install sqlite3
Since this script will be executed on Google Colab, it is unnecessary to install it.
Please import the necessary libraries to the ipynb script and mount the google drive.
import tweepy, json, time, sqlite3
import pandas as pd
from google.colab import files
# Create data on to Google Drive
from google.colab import drive
# Mount your Drive to the Colab VM.
drive.mount('/gdrive')
Copy and paste the keys and tokens you received into corresponding parameters in the code below:
consumer_key = "your_consumer_key"
consumer_secret = "your_consumer_secret"
access_token = "your_access_token"
access_token_secret = "your_access_token_secret"
This script was programmed using a class structure instead of a run-down script structure. A StreamListener is defined for later use, the main procedure will be executed after the line if __name__ == "__main__":. This piece of code was programmed with reference to https://github.com/shawn-terryah/Twitter_Geolocation. So, let us start with the main procedure and then switch to the stream listener.
class StreamListener(tweepy.StreamListener):
    """tweepy.StreamListener is a class provided by tweepy used to access
    the Twitter Streaming API to collect tweets in real-time.
    """

    def __init__(self, time_limit=60, file=""):
        """class initialization"""

    def on_data(self, data):
        """This is called when data are streamed in."""


if __name__ == "__main__":
    ....
Once we acquire the consumer key and access token, we can create a variable to handle the twitter authentication.
myauth = tweepy.OAuthHandler(consumer_key, consumer_secret)
myauth.set_access_token(access_token, access_token_secret)
To retrieve geo-tagged tweets, three bounding boxes are defined. After initializing the stream listener, a stream object is created out of tweepy.Stream object. Then, the LOCATION array is passed to the stream filter method. By doing so, the geo-tagged are filtered and collected.
LOCATIONS = [-124.7771694, 24.520833, -66.947028, 49.384472,  # Contiguous US
               -164.639405, 58.806859, -144.152365, 71.76871,  # Alaska
               -160.161542, 18.776344, -154.641396, 22.878623]  # Hawaii
stream_listener = StreamListener(time_limit=60, file=output_file)
stream = tweepy.Stream(auth=myauth, listener=stream_listener)
stream.filter(locations=LOCATIONS)
Notably, the filter not only acquires geotagged tweets but also other kinds of tweets according to the input filter strategy. tweepy allows you to filter tweets through a keyword. By choosing a keyword related to the timely topic like “coronavirus”, you can obtain data that gives you an insight into the public perception of the topic.
stream.filter(track=['coronavirus'], is_async=True)
Additionally, to use filters to stream tweets by a specific user. The following parameter is an array of IDs. For example, the Twitter ID for the white house is 822215673812119553, and you can collect tweets from this specific account. We will not be changing this parameter in this lab exercise, but consider how you can utilize this function if this is something that you would like to link to your final project.
stream.filter(follow=["2211149702"])
However, these different filtering parameter returns different data structures, and they store different information about the tweets. For this reason, keyword filtering does not return plenty of geotagged tweets. If you are changing the keyword parameter, you should run this crawler for a longer duration. To do so, simply change the time_limit parameter. For example, if you want to run this crawler for 5 minutes, set it to 300. If you are trying to use a less common keyword, the chance is you will not have a sufficient amount of data. In that case, consider running this crawler for even longer.
stream_listener = StreamListener(time_limit=60, file=output_file)
2.4 Data Collection
The on_data function processes the streamed-in/input data. Let us walk through this function in detail.
conn = sqlite3.connect(self.dbfile)
cursor = conn.cursor()
A spatialite database located at self.dbfile will be connected, and a cursor is created for this database as well.
if (time.time() - self.start_time) < self.limit:
        ...
        ...
else:
    conn.close()
    print ("finished.")
    return False
This crawler will terminate after reaching the predefined time limit self.limit. To stop the database connection, a statement conn.close() will be executed.
datajson = json.loads(data)
print (datajson)
id = datajson['id']
username = datajson['user']['screen_name']
created_at = datajson['created_at']
text = datajson['text'].strip().replace("\n", "").replace('"', '\"').replace("'", "\"")

# process the geo-tags
if datajson['coordinates'] == None:
    bbox = datajson['place']['bounding_box']['coordinates'][0]
    lng = (bbox[0][0] + bbox[2][0]) / 2.0
    lat = (bbox[0][1] + bbox[1][1]) / 2.0
else:
    lng = datajson['coordinates']['coordinates'][0]
    lat = datajson['coordinates']['coordinates'][1]
The streamed-in data is loaded to a json object datajson. A json object is easier to process and destructurize. Then, the id, username, and created_at, text as well as the geographic data are extracted.
insert_record_sql = "INSERT OR REPLACE INTO geotweets (id, username, created_at, lng, lat, text) VALUES (%d, '%s', '%s', %f, %f, '%s')" % (id, username, created_at, lng, lat, text)
cursor.execute(insert_record_sql)
conn.commit()

record = (id, username, created_at, lng, lat, text)
print (record)
As shown, new records will be inserted to this database, if a record has already been inserted, this record will not be inserted to the data table. To observe the content of the updated record, the content of record will be shown on the console of PyCharm since we print it to the console.
After executing tw2db.py on Google colab, a list of records will be inserted to the data table geotweets of the database tweets.db in Google drive, and you can also download the database to local computer.
 # download the csv to your local computer
files.download(dbname)
print("the database has been downloaded to your local computer. The program has been completed successfully.")
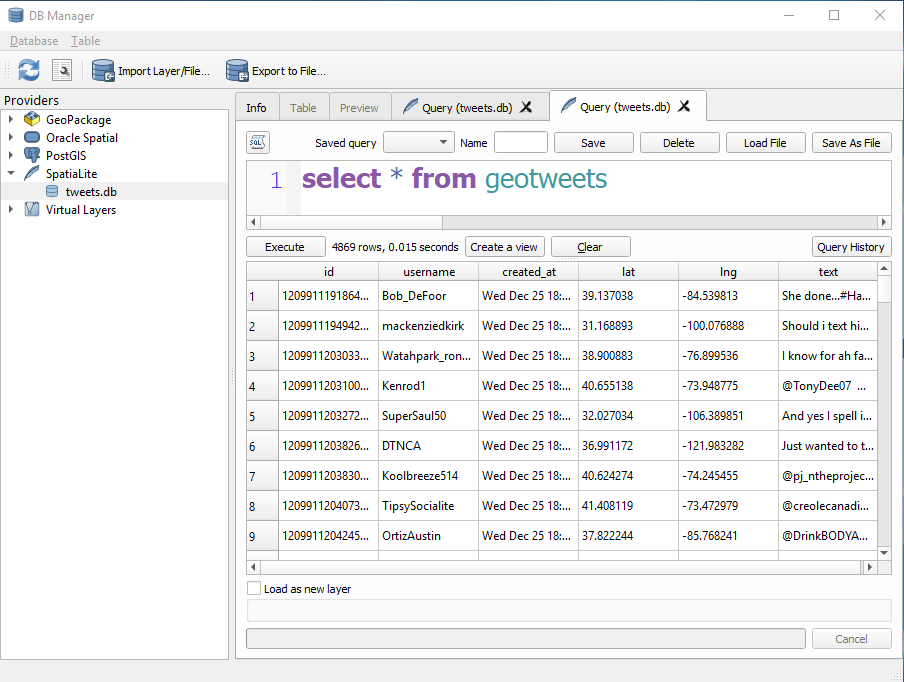
To view the inserted data table, execute the following sql statement select * from geotweets in QGIS.
2.5 Geo-enable the data table
We will add a geographic column geom to enable the data table geotweets to store geospatial datasets. To add a geographic column, run the sql statement below on the query window of QGIS’s DB Manager.
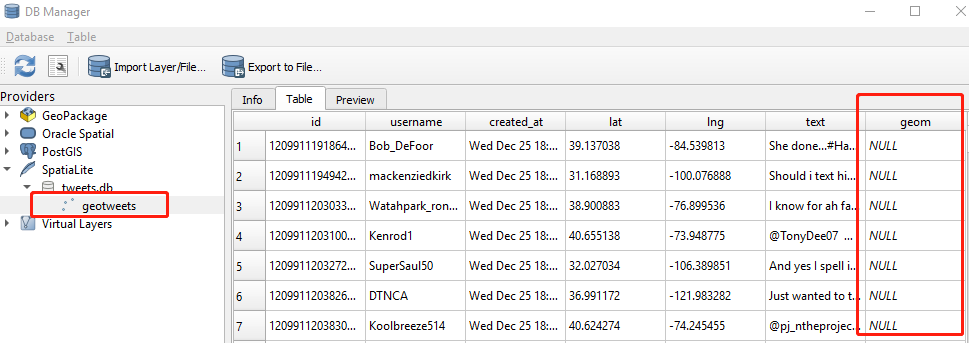
-- Create the geometry column
SELECT AddGeometryColumn('geotweets', 'geom', 4326, 'POINT', 'XY', 0);
After executing this sql statement, you can see a new NULL column was added to the data table.
Then, The geom column will be filled with the point indicating where the geotag for the tweet. The point can be made by the lat and lng column. Notably, since it is a geographic point, we will also assign a default projection WGS 84 to this point. The EPSG id of WGS 84 is 4326. So, the sql statement below will be executed.
EPSG Geodetic Parameter Dataset (also EPSG registry) is a public registry of spatial reference systems, Earth ellipsoids, coordinate transformations and related units of measurement. Each entity is assigned an EPSG code between 1024-32767, along with a standard machine-readable well-known text (WKT) representation. The dataset is actively maintained by the IOGP Geomatics Committee.
EPSG:4326 - WGS 84, latitude/longitude coordinate system based on the Earth’s center of mass, used by the Global Positioning System among others.
EPSG:3857 - Web Mercator projection used for display by many web-based mapping tools, including Google Maps and OpenStreetMap.
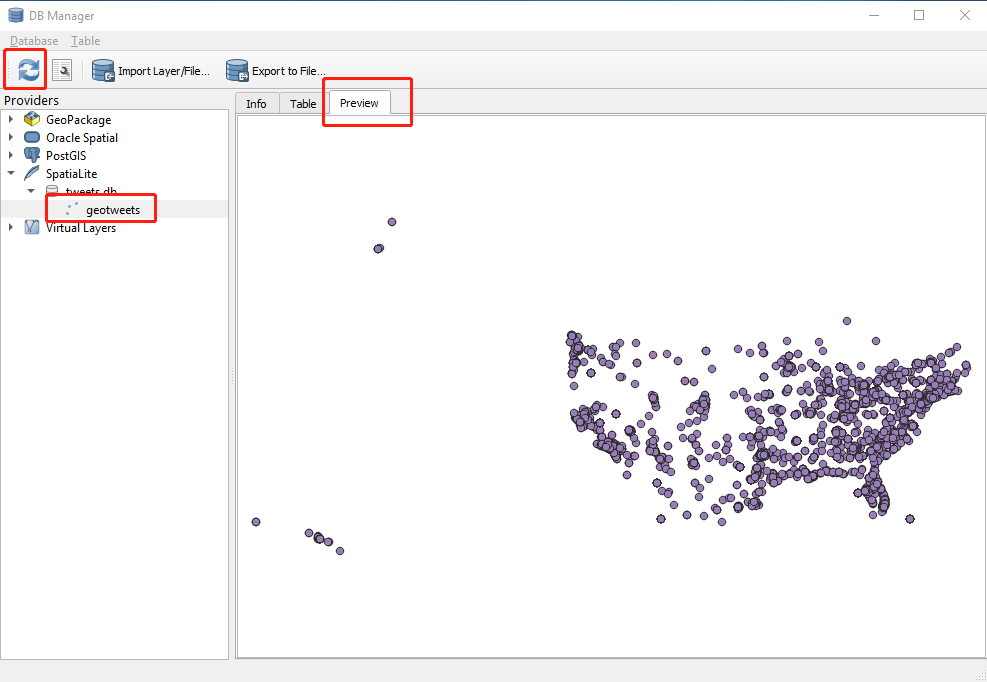
-- Update the geometry column
update geotweets set geom = MakePoint(lng, lat, 4326);
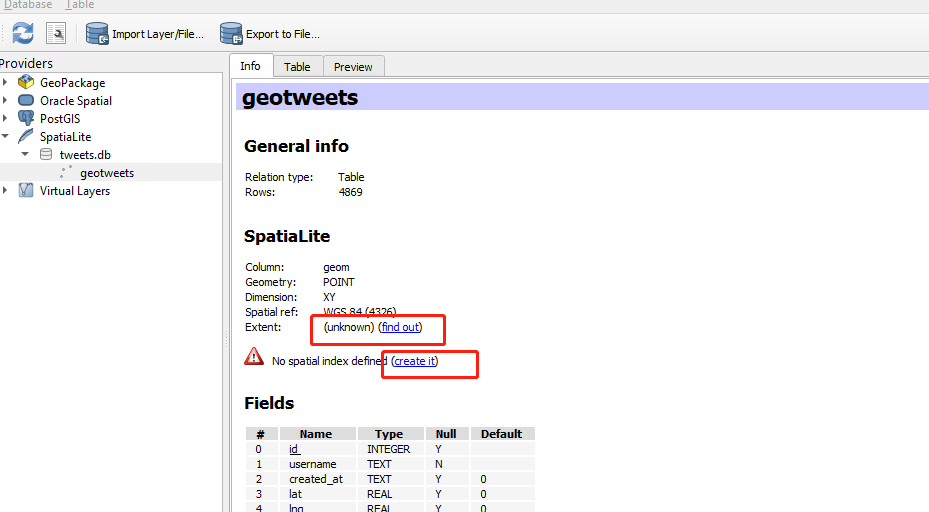
Then, a geographic column will be created. Pressing the first button to the left on the main menu to refresh the DB manager. If switching to the Preview tab of the main window, we can actually see a map of the visualized data from the geotweets data table.
2.6 And more
Build spatial data index and compute boundingbox
To speed up the data search or operation, the spatial data index can be built and the boundingbox can be computed. To do so, please switch to the info tab and click on the find out and create it links.
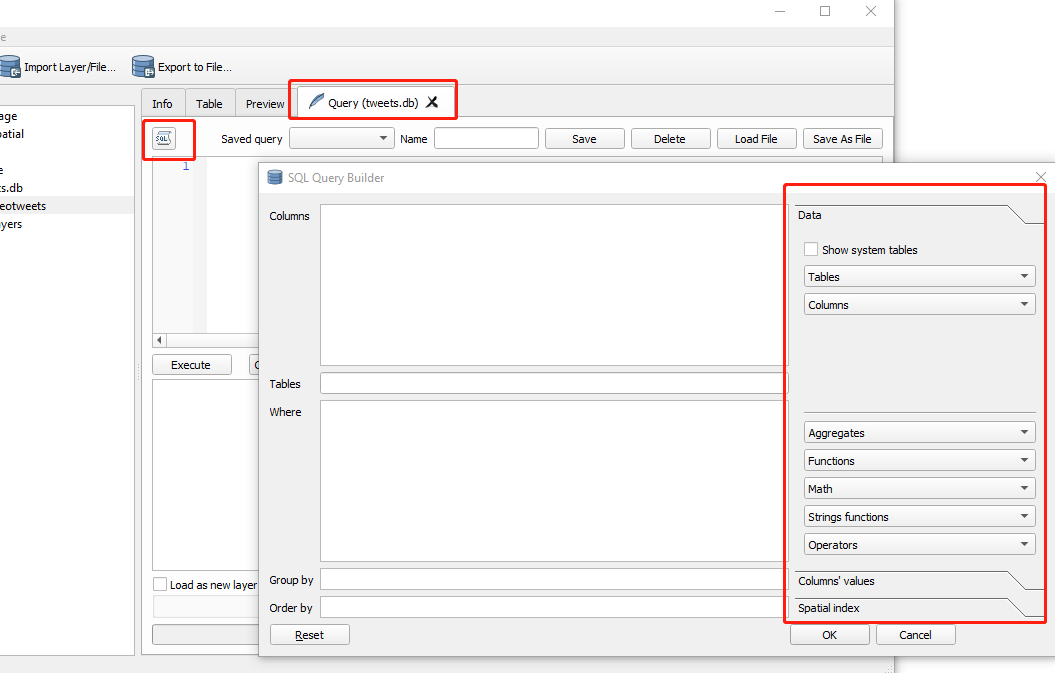
Become a Guru of Spatialite
A spatial databse supports spatial query and join. For example, you can generate buffers around each geo-tagged tweet, check which of the geo-tagged tweets fall in the city limits of Seattle. You can compose a (spatial) query on the textbox of the Query tab, or you can open the SQL Query Builder to help you compose an advanced query. As shown below.
If you want to learn more about SpatiaLite, the materials below are recommended:
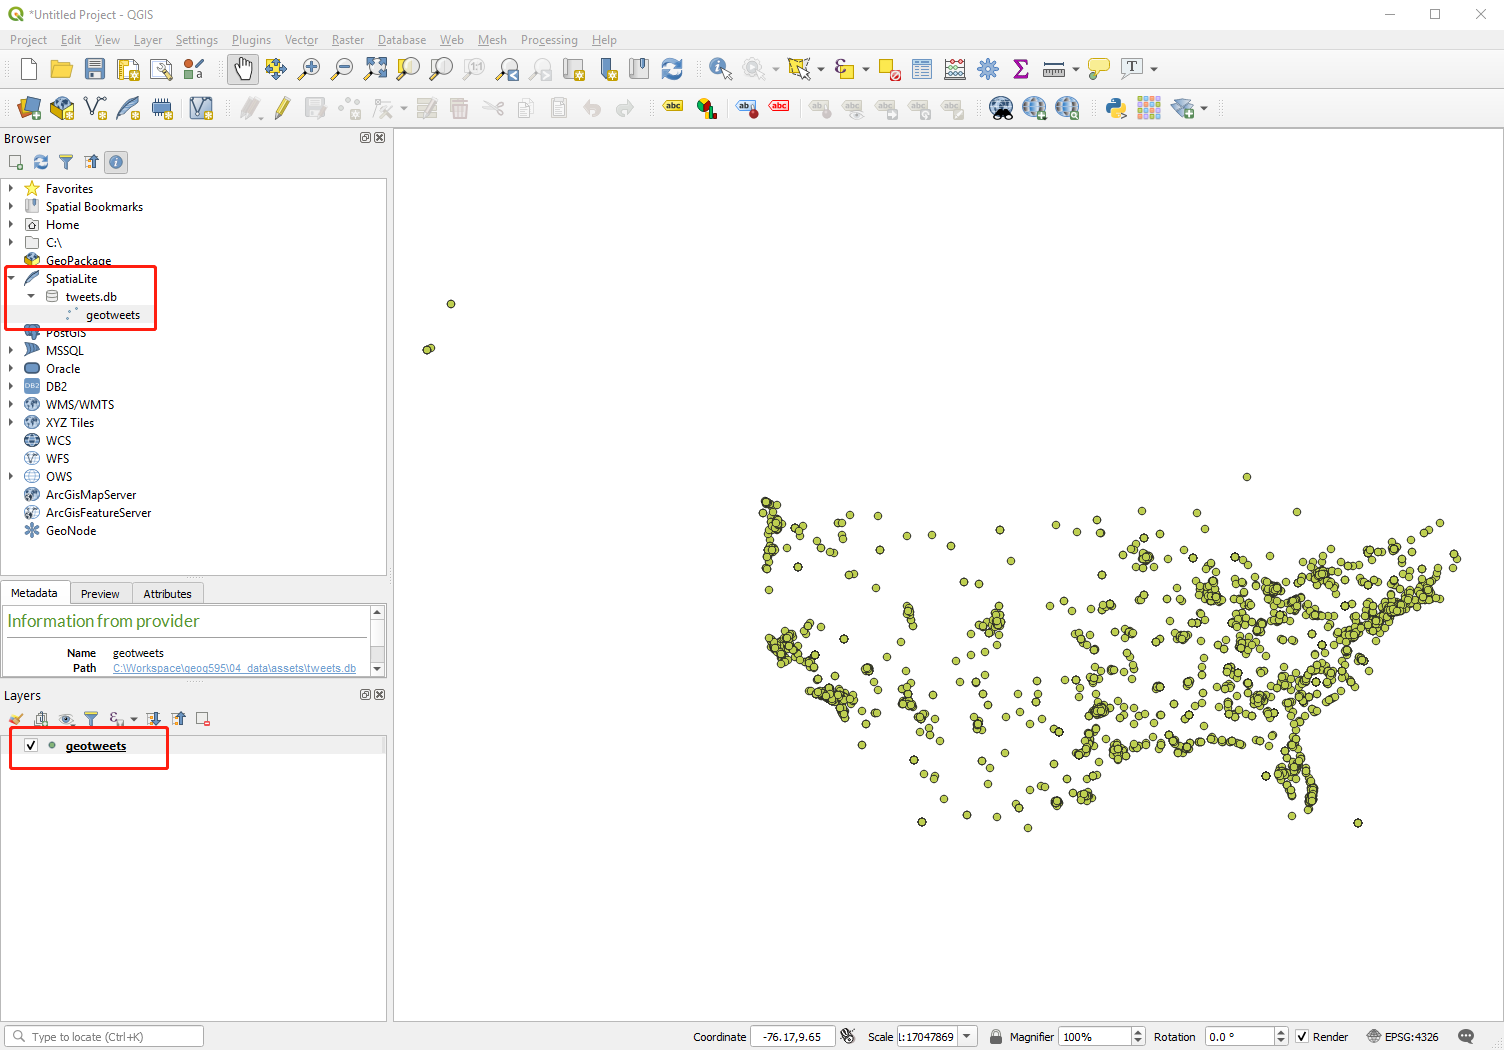
Visualize data stored in a spatialite database
The geospatial data from a spatialite can be visualize and further analyzed in a QGIS environment. To visualize a spatial data table, you need to open QGIS, navigate to the Browser Panel on the top left, in the spatialite categorize, find the spatial date table inside of a spatial database. By clicking on the data table, a new layer will be added to the Layers Panel and the layer will be simultaneously visualized in the main panel.
Then, you can conduct any supported spatial analytical functions onto this spatial layer. If you prefer using ArcGIS platform, you can export the spatial data table as a shapefile for later use in ArcGIS. To do so, right click on the layer geotweets in the Layers Panel. On the dropdown Menu, choose Export--> Save Features As.... On the popup window, choose ESRI Shapefile as the export format.
Import data to a Spatialite
SpatiaLite can be used to manage spreadsheet and most types of geospatial data. To import data to Spatialite is straightforward. We will walk through the steps as follows. Note: You can insert raster data or satellite image as a binary field. We would not introduce in this instruction, if you are interested in, please read this tutorial on RasterLite.
In the assets, you will find two data files, in terms of a polygon data states.geojson showing the administration boundary of all states in the U.S., and another spreadsheet [pop.csv] containing the population data of each state estimated in 2014 census.
Drag and drop these two files respectively to the Layers Panel. Then you will see two layers are listed in the panel and only the states layer is visualized in the map panel. Apparently, the pop.csv does not have geometrical feature, so it would not be visualized.
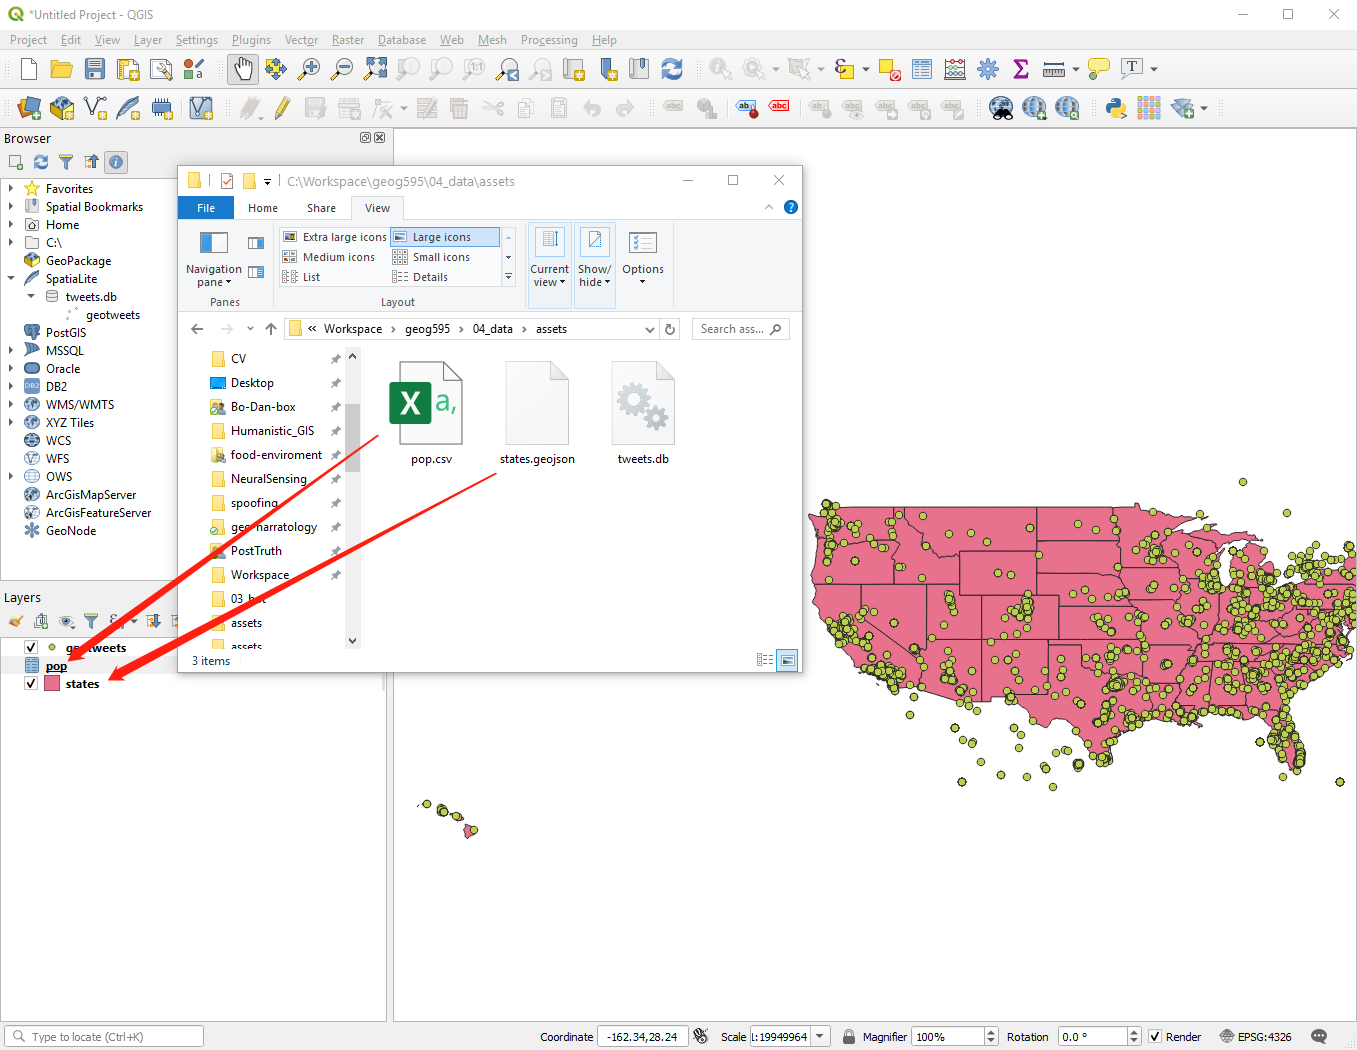
Drag and drop these two layers from the Layer Panel to the database file tweets.db in the Browser Panel. Then, you can immediately see two extra tables are added to the database tweets.db.
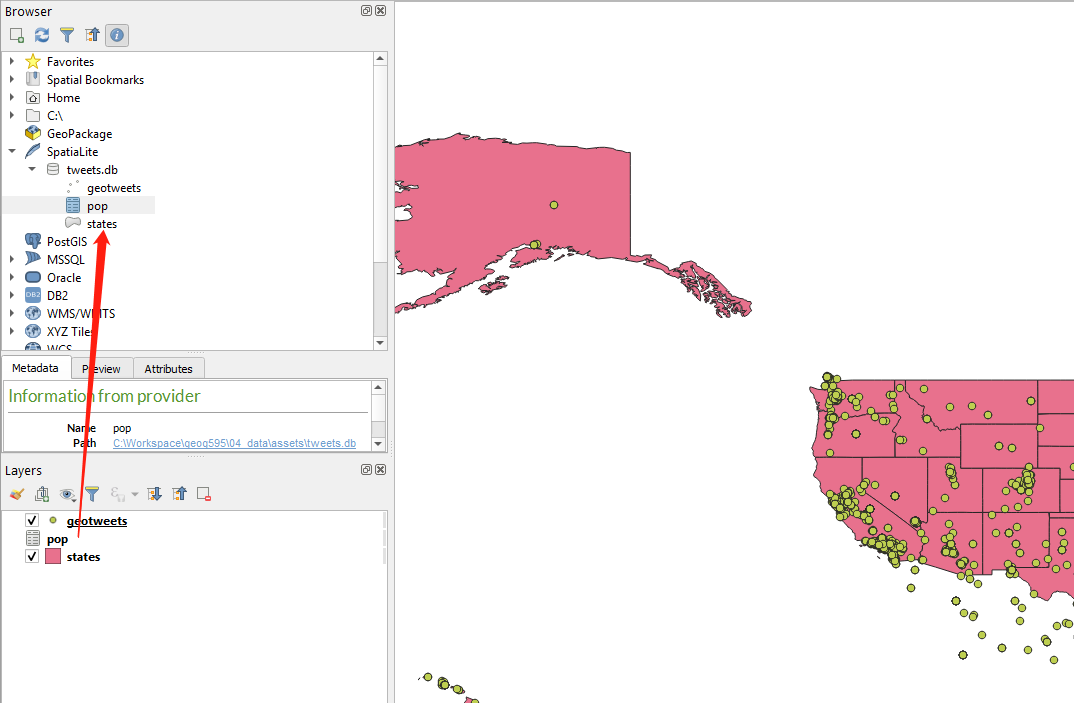
By doing so, the database tweets.db can store and manage all the three data tables, in terms of geotweets - geographic point feature, states - a polygon feature and pop - an attribute table. Apparently, it is relatively convenient to manage (spatial) database with spatialite. You do not need to worry about storing all the associated files like shapefile, and it is also very easy for data migration and reuse.
3. Deliverable
You are expected to walk through this instruction, practice how to store the geo-tagged tweets to a spatialite and visualize it in QGIS platform. More importantly, by learning this practical exercise, you are expected to manage the research data onto a spatial database.
So, to submit your deliverable, please,
-
Share a spatialite database of your research data to the Canvas Dropbox of this practical exercise. (30 POINTS)
-
Along with the database, please also attach a word document or a pdf file to describe what the tables/layers in the database are and how they are related to your research questions. (20 POINTS)
Acknowledgement
I want to express my gratitude to Jou Ho who provided me research assistance on developing this assignment. The usual disclaims apply.